Brief Description
The topic is first introduced with a few questions, to bring everyone on the same page. A simple analogue experiment is employed as a model of the insolation of sunlight on Earth. A strong lamp illuminates a photovoltaic cell, which is connected to an electric motor. When varying the angle of the solar cell towards the lamp, the motor changes its rotation speed. This serves as a model for the changing incident angle of insolation with varying latitude. This gives rise to the climate zones on Earth. The same observations also illustrate the seasonal effect of the changing insolation due to the Earth revolving around the Sun.
This resource is part of the educational kit "The Climate Box". You can read more about the kit in the presentation attached. Find all related resources selecting the category "Our fragile planet" and "secondary level".
Goals
After this activity, pupils will understand that
- the energy any place on Earth receives depends on the incident angle of the irradiating sunlight.
- the climates are mainly caused by the latitude dependent insolation.
- the climate zones are an average of long term weather conditions.
- the climate zones are generally aligned with the latitudes of the Earth.
- the seasons are caused by the same inclination effect of insolation at different latitudes.
- the annual changes of insolation angles originate from the tilted Earth axis, whose position in space remains (almost) fixed during the revolution around the Sun.
Learning Objectives
The goals are achieved by an experiment that demonstrates the basic process that is the reason the generation climate zones and the seasons. The students have to observe carefully and transfer the results of the experiment to the configuration of the Sun and the Earth. By realising that they are looking at basically the same process, both in the experiment and the Sun-Earth system, the students will understand that the energy available to heat the surface of the Earth depends on the incident angle and, consequently, on the latitude of the Earth.
Evaluation
Answers to questions
Question 1: The equator is the line or circumference on the globe half way between the poles.
Question 2: Ecuador (Quito, Galapagos), Brazil, Gabun (Libreville), Kongo, Uganda (Kampala), Kenia, Malaysia, Indonesia
Question 3: Rainforest
Question 4: humid and warm, lots of rain
Question 5: The sun shines directly from above.
Question 6: The sun shines at grazing angles, which heats the ground less effectively.
Pupils are supposed to give an explanation in their own wording for the phenomenon witnessed. In case the necessary physical basic concepts have not been reviewed yet the pupils should be able to explain their observations in their own wording.
Question 7 + 8: List the climate zones from the equator towards the two poles.
- Tropical or equatorial climates
- Arid climates
- Warm temperate climates
- Cold or snow climates
- Polar climates
Question 9: During northern winter, the sun beams hit the Earth at more grazing angles for northern latitudes than during northern summer. The insolation during summer leads to a more effective heating. That is why the temperatures are higher in the summer than during winter.
Question 10: At the equator, the surface of the Earth generally faces the Sun direction. Towards the poles, the angle between the surface of the Earth surface and the irradiating Sun decreases. With increasing geographic latitude the power per area unit reaching the Earth decreases. This means that also the solar constant depends on the angle α between the direction to the Sun and the normal vector of the Earth’s surface.

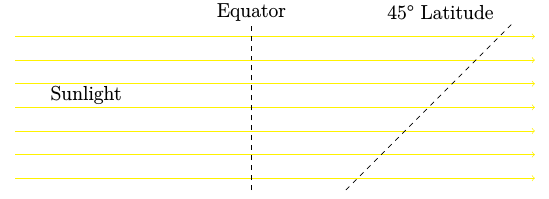
Figure 1: Comparison of sunbeams hitting the surface of the Earth in an angle that is perpendicular (left) and tilted by 45° (right) with respect to the surface. The configuration to the right distributes the incident radiation along a longer line than the one to the left (own work).
Observation
The rotation speed decreases with an increasing angle facing away from the lamp.
Conclusions
With an angular lighting less energy hits the same surface.
With increasing angles of the solar cell, the cross section that receives light gets smaller. As a result, the total amount of energy received drops. Less energy is available to drive the motor.
With increasing latitude, the incident angle of insolation drops. This is comparable to what was observed in the experiment. Less energy reaches the same unit area. Therefore, the heating is less effective.
Materials
Since photovoltaic cells are quite expensive, teachers may prepare a restricted number of experimental set-ups. The experiment needs the following items.
- Strong lamp or floodlight
- Photovoltaic cell with attached electric motor (be sure that the power the cell generates is big enough to drive the motor)
Background Information
The climate
The climate is defined as the long term average of weather or atmospheric phenomena, often modified by seasonal variations. In order to make a statement about the climate, weather data have to be recorded over a long period, typically 20 or 30 years. This avoids confusion with short term contributions.
The Climate Zones
Climate zones describe areas with similar climatic conditions, which are located in form of belts in an east-western direction around the Earth. They are roughly parallel to the latitudes. As a first approach, these climate zones can be described with the angle dependence of the solar constant, which will be discussed in the following.
The sunlight hits the Earth with almost parallel beams.
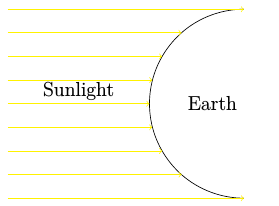
Figure 2: Illustration of how parallel sunbeams hit the Earth. The incident angle of insolation changes with latitude (own work).
At the equator, the surface of the Earth generally faces the Sun direction. Towards the poles, the angle between the surface of the Earth surface and the irradiating Sun decreases. With increasing geographic latitude the power per area unit reaching the Earth decreases.
This means that also the solar constant depends on the angle α between the direction to the Sun and the normal vector of the Earth’s surface.

Considering also the tilt of the axis of the Earth axis of β=23,5°, the seasonal angle variation can be determined.

In this case, t has to be a time of dates after 21st March of a given year, and α corresponds to the geographic latitude.
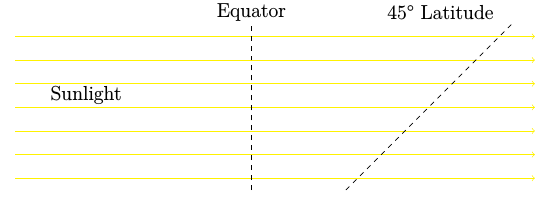
Figure 3: Comparison of sunbeams hitting the surface of the Earth in an angle that is perpendicular (left) and tilted by 45° (right) with respect to the surface. The configuration to the right distributes the incident radiation along a longer line than the one to the left (own work).
A smaller solar constant means that the earth warms up less in this area thus causing the different climate zones.
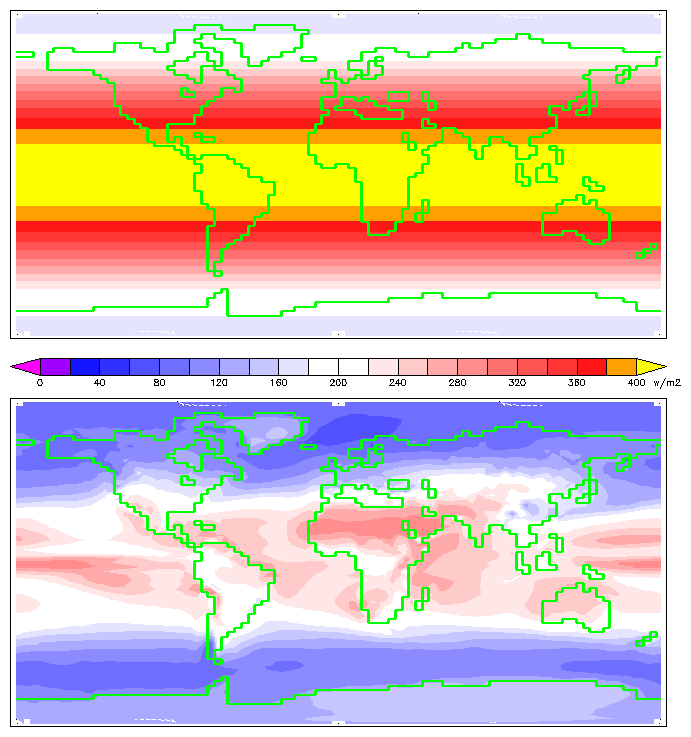
Figure 4: Annual mean insolation at the top of Earth's atmosphere (upper) and at the planet's surface (lower) in W/m2. The visualisation is based on the HadCM3 climate model developed by the Met Office Hadley Centre for Climate Change (William M. Conolley, https://commons.wikimedia.org/wiki/File:Insolation.png, https://creativecommons.org/licenses/by-sa/3.0/legalcode)
As Figure 4 demonstrates, the strong dependence of the degree of insolation and geographic latitude is in reality modified by influences like atmosphere, oceans, geography as well as streams and currents that dissipate absorbed radiation.
While Figure 4 is based on model calculations, Figure 5 shows the actually measured distribution of the annual radiative power received on ground. To compare the numbers, the total energy per year given in kWh can be translated into an annual mean power given in W.

This comparison also demonstrates that the model and reality correspond very well.
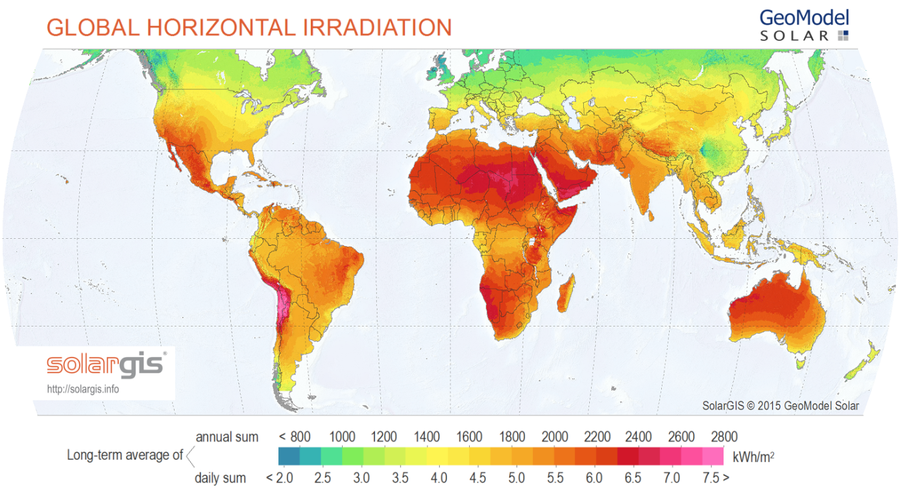
Figure 5: Global distribution of measured annual insolation. The horizontal irradiation is the radiation received from above by a surface horizontal to the ground. The accumulated energy is given in units of kWh/m2 (Credit: SolarGIS © 2016 GeoModel Solar, http://solargis.info/doc/free-solar-radiation-maps-GHI, https://creativecommons.org/licenses/by-sa/3.0/legalcode).
The distribution of global mean insolation can be translated into a map of climate zones as shown in Figure 6.
The climate zones shown in Figure 6 can be summarised under five main groups.
- Tropical or equatorial climates
- Arid climates
- Warm temperate climates
- Cold or snow climates
- Polar climates
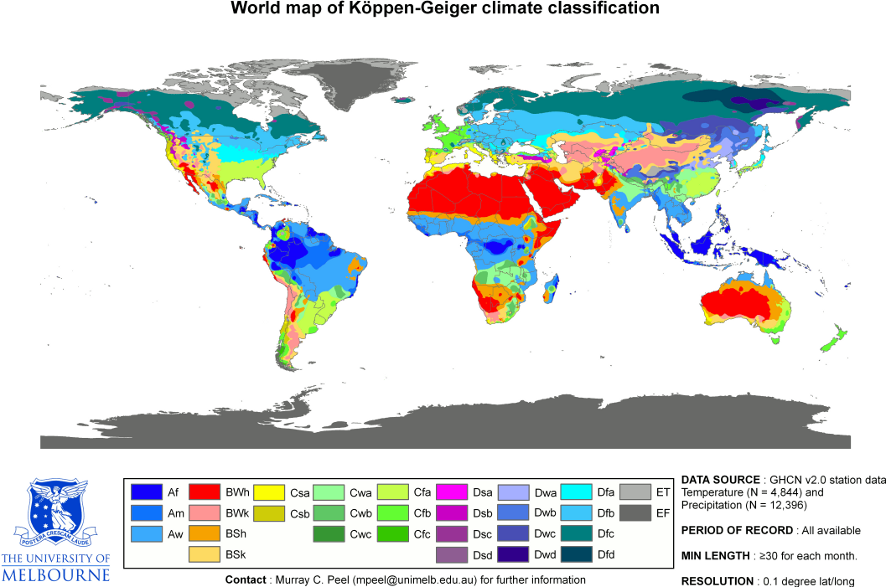
Figure 6: World map of climate zones (Credit: Peel, M. C., Finlayson, B. L., and McMahon, T. A.: Updated world map of the Köppen-Geiger climate classification, Hydrol. Earth Syst. Sci., 11, 1633-1644, doi:10.5194/hess-11-1633-2007, 2007, https://commons.wikimedia.org/wiki/File:World_Koppen_Map.png, free cultural work)
Seasons
The seasons throughout the year are caused by a very similar effect. The axis of the Earth is tilted by 23.5° with regard to its orbit around the Sun. As a result, the incident angle of insolation for a given time during the day changes throughout the year (Figure 7).
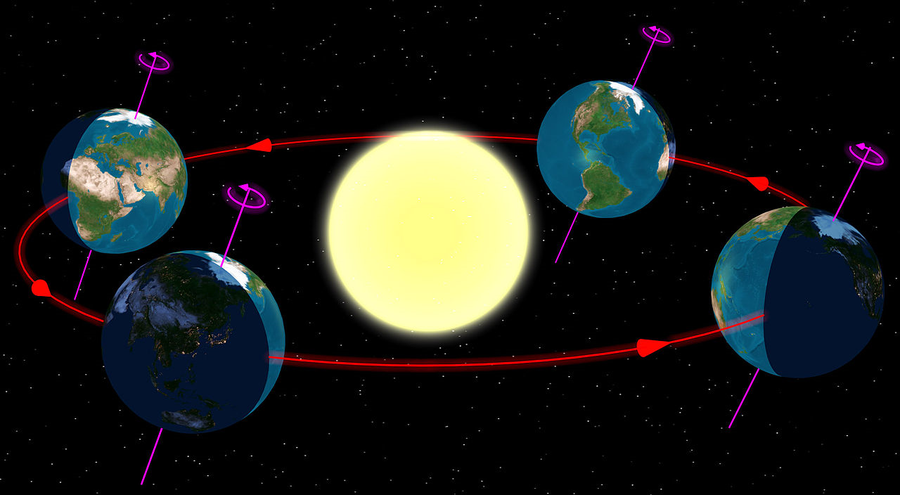
Figure 7: The axis of the earth is tilted by 23.5° with regard to its orbit around the sun. As a result, the incident angle of insolation for a given time during the day changes throughout the year (https://commons.wikimedia.org/wiki/File:North_season.jpg).
When we look at the two extreme situations, the solstices, sunlight reaches the most northern and most southern extent on Earth, respectively (Figure 8). During northern winter, the sun beams hit the Earth at more grazing angles for northern latitudes than during northern summer. As for the generation of climate zones, the insolation during summer leads to a more effective heating. That is why the temperatures are higher in the summer than during winter.

Figure 8: Illumination of the Earth at northern winter (left) and summer (right) solstice (Credit: combined by M. Nielbock using images of Przemyslaw Idzkiewicz (illuminated Earth), https://en.wikipedia.org/wiki/File:Earth-lighting-summer-solstice_EN.png, https://commons.wikimedia.org/wiki/File:Earth-lighting-winter-solstice_EN.png, https://creativecommons.org/licenses/by-sa/2.0/legalcode, and NASA (the Sun), http://solarscience.msfc.nasa.gov/surface.shtml).
Full Activity Description
Introduction
Show the students an Earth globe or a global map and ask them, if they can identify the equator.
Question 1: Where are the poles? Where does the equator lie relative to the poles?
If possible, let the students use an on-line map tool to investigate the geography and satellite images of the equator region.
Question 2: Can you name countries that touch the equator? Do you know any cities close to it?
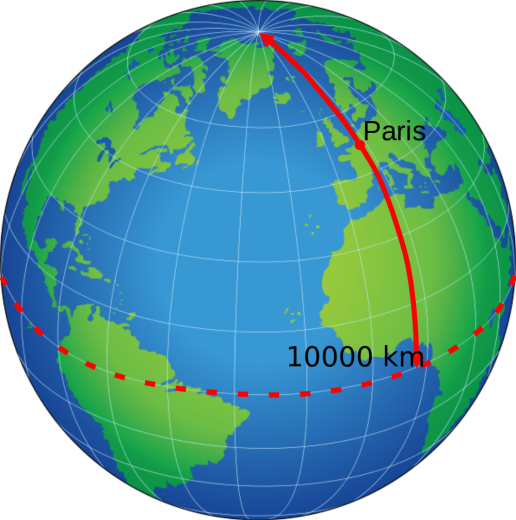
Figure 9: Illustration of the Earth globe and the position of the equator relative to the North Pole (Credit: US Government, https://commons.wikimedia.org/wiki/File:Kilometre_definition.svg)
Question 3: What is the typical vegetation there? A closer look at the satellite images helps to answer the question.
Question 4: What is the typical weather there (humid or dry, cold or warm)?
Question 5: What is the main reason for the high temperatures there?
Question 6: Why is it colder far away from the equator?
Now introduce the climates and climate zones. Climate zones are areas that differ from each other due to their different climatic conditions. The climate is defined as the long term average of weather or atmospheric phenomena, often modified by seasonal variations
Question 7: Which climate zones do you know?
Question 8: How are the climate zones distributed over the Earth?
Question 9: What is the reason for the temperature variations between summer and winter?
Question 10: How can this be attributed to different regions on our planet?
Experimental set-up
- Solder the motor to the photovoltaic cell.
- A coloured disc made of cardboard attached to the rotation axis improves the observation.
- Plug the lamp into the dimmer and then the dimmer into the socket.
- Place the lamp in a way that it shines horizontally.
Experimental procedure
- Switch on the lamp.
- Put the photovoltaic cell in a distance of about 5 cm facing the lamp. The motor is supposed to rotate.
- Change the angle of the solar cell and observe the rotational speed.
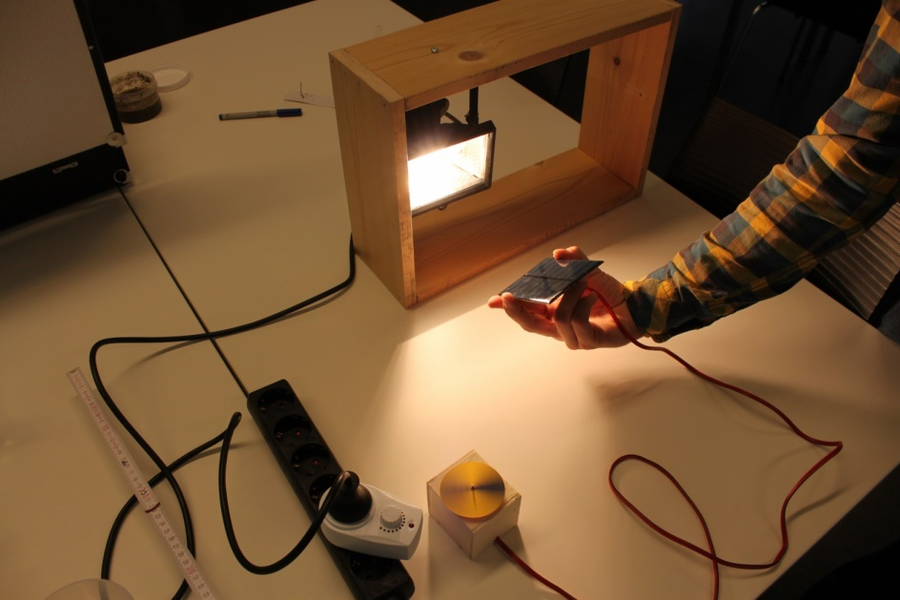
Figure 10: Experimental set-up.
Task
Write down your observations.
Which conclusions can you draw from them?
Why did the motor change its speed when varying the angle?
What does that mean for regions on Earth from which the Sun shines at different angles?
Excursus: Climate Zones
The light of the sun hits the earth in almost parallel beams.

Figure 11: Illustration of how parallel sunbeams hit the Earth. The incident angle of insolation changes with latitude (own work).
At the equator, the surface of the Earth generally faces the Sun direction. Towards the poles, the angle between the surface of the Earth surface and the irradiating Sun decreases. With increasing geographic latitude the power per area unit reaching the Earth decreases.

Figure 12: Comparison of sunbeams hitting the surface of the Earth in an angle that is perpendicular (left) and tilted by 45° (right) with respect to the surface. The configuration to the right distributes the incident radiation along a longer line than the one to the left (own work).
Less energy per surface area means that warming is less effective.
Curriculum
Space Awareness curricula topics (EU and South Africa)
Our fragile planet, Orbit and rotation, seasons
Conclusion
The activity demonstrates with rather simple means the effect of changing angles of illumination. In the Sun-Earth system, it gives rise to the climate zones and the seasons. The experiment illustrates this with a lamp representing the Sun and a solar cell which provides a measure of different incident angles of insolation on Earth by simply turning it. The motor attached to it, reacts to the varying effective energy that is generated to drive it. The rotation speed is an analogue for the heating rate on Earth at different latitudes and seasons. The students will realise that even complex natural phenomena can be illustrated by rather simple experiments.

This resource was developed by Marco Türk, Heidelberg University with important contributions by Markus Nielbock, Haus der Astronomie, Heidelberg, Germany. This resource is under peer-review, proof reading, and will be updated and improved in the coming year.

